Food Insecurity Remains Elevated Across All 50 States
Large increase in unemployment explains more than half of the increase in food insecurity
Get all our news
During the COVID-19 health emergency, the rate of food insecurity for households with children more than tripled to 29.5%. Approximately half of this increase can be explained by the increase in the unemployment rate.”
Diane Schanzenbach and Abigail Pitts
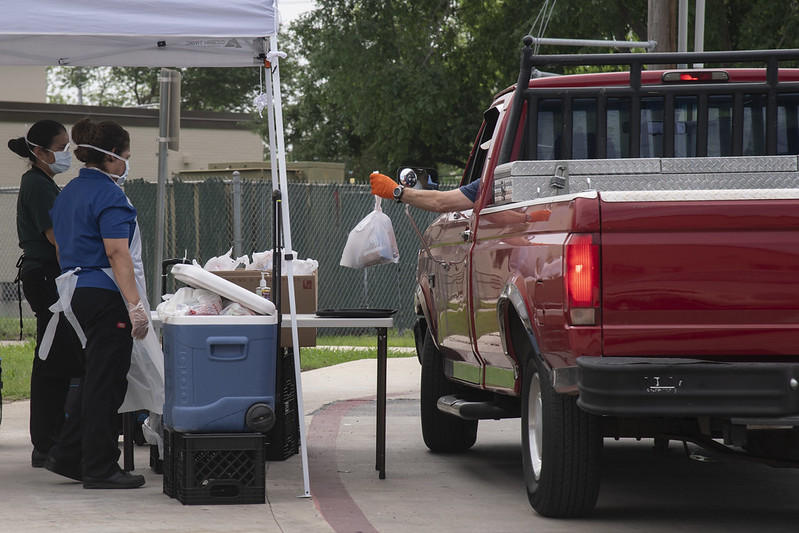
Armando Leal Jr. Middle School's staff in San Antonio, Texas, distribute food to drivers picking up meals for their children.
The COVID-19 health emergency has led to a sharp economic slowdown, with soaring unemployment and spikes in need as illustrated by news reports of miles-long lines at food pantries. In our latest report, we estimate current rates of food insecurity and the extent to which food insecurity rates have increased in national data and by state using the Census’s Household Pulse Survey (CHHPS). We find that food insecurity has doubled overall, and tripled among households with children. Food insecurity is elevated across all states, with some states experiencing extremely high rates and/or increases in food insecurity. Across the nation, 7% of households reported receiving free food during the prior week.
To compare measures collected during the COVID-19 health emergency to prior measures, we make several adjustments between the CHHPS and the Current Population Survey’s Food Security Supplement (CPS-FSS), which is the source of the U.S. Department of Agriculture’s annual reports. (See the report for a more complete discussion of our methodology.)
Twenty-three percent of households overall experienced food insecurity in the first 3 waves of the CHHPS, which was collected from April 23–May 19. Blacks and Hispanics had higher rates than whites, at 36% and 32% respectively versus 18% for whites. Among households with children, 30% overall were food insecure; 41% of households with a black respondent and 36% of those with a Hispanic respondent were food insecure.
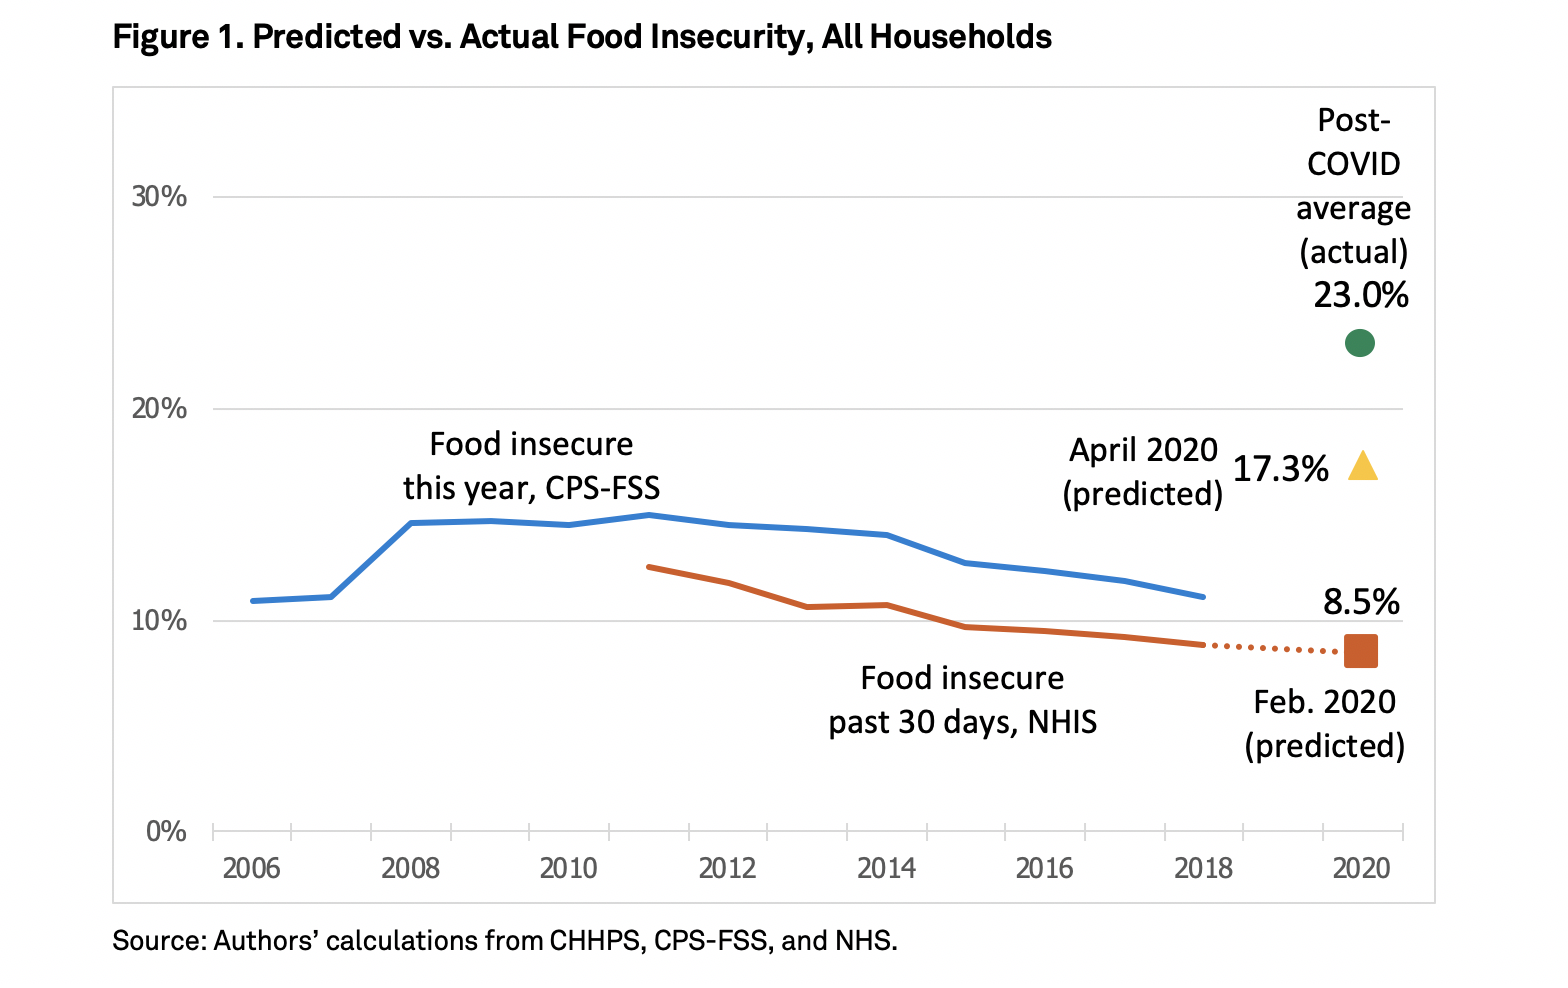
We also estimate what food insecurity was likely to be on the eve of the COVID-19 health emergency. We can compare this predicted rate in February 2020 to food insecurity from the CHHPS, which was 23.0% over the April 23–May 19 period and is represented by the green circle in Figure 1. The post-COVID estimates are 2.7 times those estimated for February 2020. There was a large increase in unemployment, from 3.9% in February to 14.7% in April. Based on this change in unemployment rate, the expected food insecurity rate in April would have been 17.3%—in other words, the increase in unemployment explains more than half of the increase in food insecurity.
We also repeat the same exercise for households with children, who always have a higher rate of food insecurity than do households overall. We predict that the February 2020 likely level of food insecurity was 9.4%. During the COVID-19 health emergency, the rate of food insecurity for households with children more than tripled to 29.5%. Approximately half of this increase can be explained by the increase in the unemployment rate, and 65% could be explained if the unemployment rate were adjusted to include as unemployed workers reporting they were “not at work for other reasons.” Low-income families have been hit particularly hard during this period, between loss of subsidized school meals due to school closures, particularly elevated unemployment rates among women, and delays in some relief payments such as the slow rollout of the Pandemic Electronic Benefit Transfer (P-EBT) program that provides resources to replace missed school meals, as well as delayed unemployment insurance payments in many states.
Since the CHHPS data contains respondents from all 50 states, we can do the same exercise of translating food insufficiency into food insecurity by state using an analogous conditional means approach with the CPS-FSS. Overall, we find that the COVID-19 crisis has not impacted everywhere in the U.S. equally as demonstrated by disparate food insecurity rates by state. The complete table with data for all 50 states and the District of Columbia can be viewed here.
*See the complete report for all tables and figures.
Diane Whitmore Schanzenbach is the Margaret Walker Alexander Professor and IPR Director. Abigail Pitts is a research analyst.
Photo credits: USDA Photo by Lance Cheung
Published: June 10, 2020. Updated: September 9, 2020.