IPR Researchers Are Putting Data Into Action
New apps and visualization tools are delivering data on critical topics to policymakers and the public
Get all our news
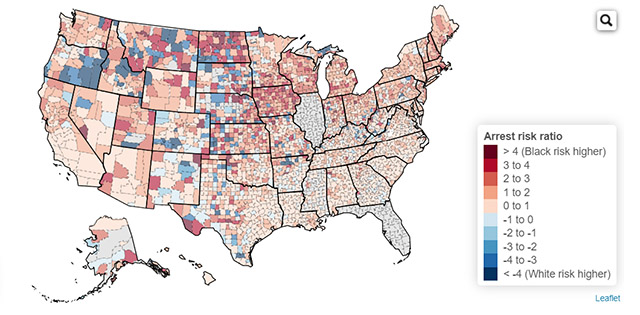
IPR sociologist Beth Redbird's map of racial disparities in arrests.
As the volume of information produced in the world increases every day, more data than ever is at the public’s fingertips. Simply generating and collecting data, however, does not necessarily lead to its use—so IPR researchers have started developing tools to do just that.
Recently, three IPR researchers, IPR Director and economist Diane Whitmore Schanzenbach, sociologist Beth Redbird, and statistician Elizabeth Tipton, have built data visualization tools for policymakers and the public that are demonstrating the impact of COVID-19, as well as how to run better education studies.
“Thanks to a growing trend of open datasets, access to the data in so many critical areas has never been more ubiquitous,” Schanzenbach said. “But to be usable to policymakers, data need to be organized in a way that non-experts can understand it. I am glad to see IPR researchers building tools to improve access and usability of data.”
As rates of food insecurity have soared during the COVID-19 crisis, Schanzenbach and research analyst Abigail Pitts have been collecting and analyzing data from the U.S. Census Bureau’s Household Pulse Survey since mid-May. According to weekly data released from April 23–June 30, 25% of all respondents reported experiencing food insecurity. Those rates can vary widely across states, ranging from a low of 15% in Vermont to a high of 32% in Mississippi.
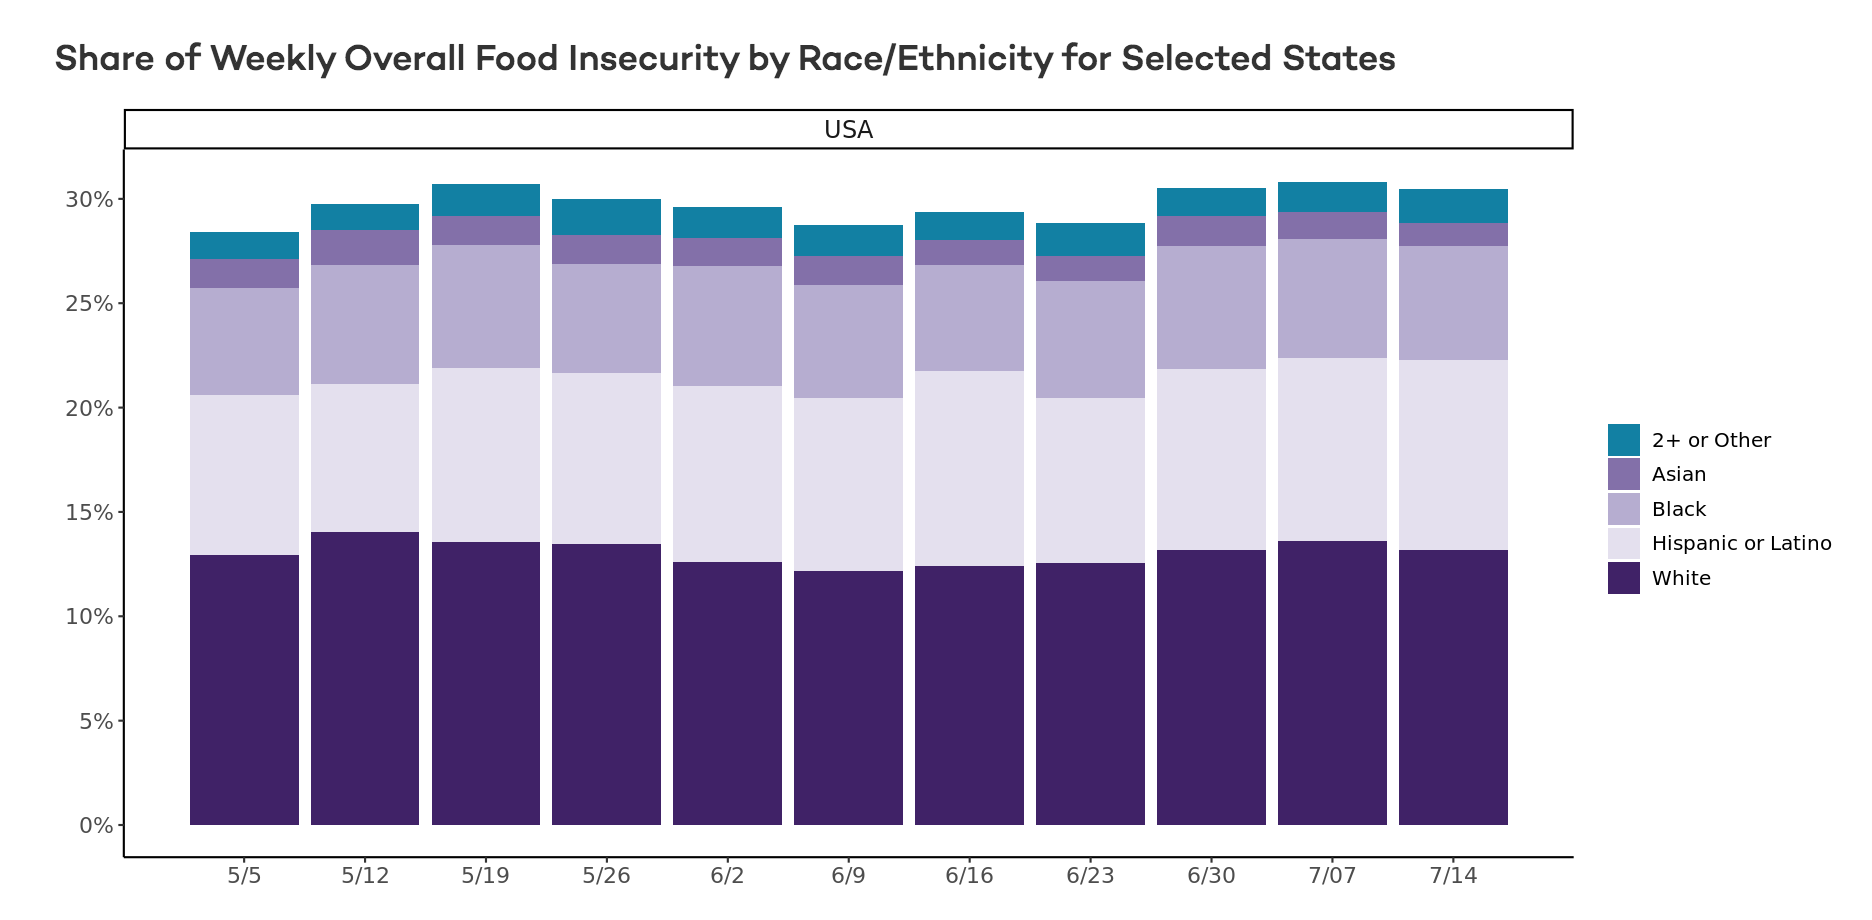
Schanzenbach and IPR summer undergraduate research assistant Natalie Tomeh developed an app that brings those data to life. Their visualization tool uses data from the Census Household Pulse Survey to show weekly rates of food insecurity for respondents with and without children, sortable by race and ethnicity for selected states.
Redbird has also turned her eye to data surrounding another hot-button topic—racial disparities in policing, taking a more in-depth, data-driven dive as to how, where, and why they occur. With sociology graduate student Kat Albrecht, Redbird has compiled data from FBI records of nationwide arrests from 1999–2015 to create a new visual tool that shows how those disparities have grown over time.
By tracking county by county the extent to which Black Americans are arrested at a higher rate than White Americans, a trend that has only accelerated in recent decades, Redbird and Albrecht have created a map of police bias across America. Their app also includes data on the arrests of Asian Americans and American Indians, the latter of whom saw an increase in arrest rates that matches that among Blacks.
The tool draws from a recent working paper in which Redbird analyzed data from more than 13,000 law enforcement agencies nationwide. She and Albrecht discovered that even while crime rates fell in recent decades, the racial disparity in arrest rates nearly doubled. As Redbird and Albrecht write, such vast disparities can “delegitimize law enforcement, increase tension between police and citizens, and even increase crime.”
In addition to headline policy topics, there are more data than ever surrounding persistent problems in the research community, like how to conduct effective studies that will improve America’s classrooms. With myriad options, how can researchers best choose the classroom, school, and school district samples to evaluate educational programs? Tipton has built a new web tool that will improve research methods so that evidence is more generalizable, providing concrete help for designing accurate studies.
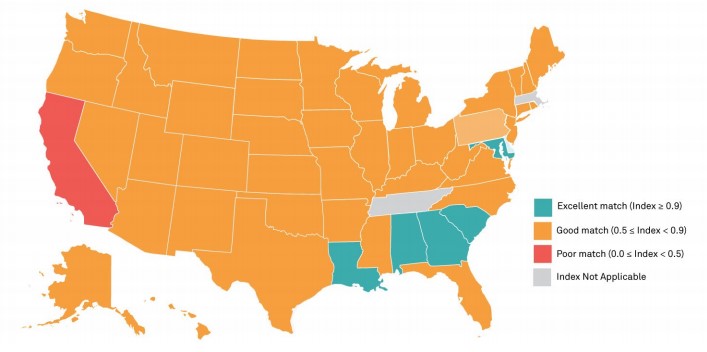
With a Spencer Foundation grant, she created a web-based, user-friendly tool for K–12 education researchers called the “The Generalizer.” In less than an hour, users receive a zip file that lists appropriate schools and directions for recruiting a population for their experiments. The Generalizer allows users to define their research populations using geographic, demographic, and administrative criteria from the Common Core of Data and the American Community Survey.
Tipton and Jessaca Spybrook of Western Michigan University are now working on The Generalizer 2.0, thanks to an Institute of Education Sciences (IES) grant. The second version will allow researchers also offer power analysis, which determines the level of confidence the researcher has in the sample size and effect size. The latter will help to make it a “one-stop shop” for planning studies. As a result of a second IES grant with Michael Weiss of MDRC, this updated version will also include data for those planning evaluations of community college and university interventions from the Integrated Postsecondary Education Data System, or IPEDS.
“We know that interventions can vary in effectiveness depending upon the contexts in which they are implemented, meaning that it is paramount that researchers identify the population their study focuses on and recruit schools that represent this,” Tipton said.
With these tools, as well as others in the works, IPR researchers are continuing not only to provide the evidence needed to make people’s lives better, but to make that evidence accessible to a wider public in an ever-changing information environment.
Diane Whitmore Schanzenbach is the Margaret Walker Alexander Professor and IPR Director. Abigail Pitts is a research analyst. Natalie Tomeh is an IPR summer undergraduate research assistant. Beth Redbird is a Weinberg College and IPR fellow and a faculty member in Northwestern’s Native American and Indigenous Peoples Initiative. Kat Albrech is a graduate research assistant. Elizabeth Tipton is an associate professor of statistics, Co-Director of the STEPP Center, and an IPR fellow. The full archive of Schanzenbach and Pitts' research on food insecurity can be viewed here.
Published: July 31, 2020.