Food Insecurity in the Census Household Pulse Survey Data Tables
Get all our news
In this report, we analyze food insufficiency rates from the first two weeks of Census Household Pulse Survey summary tables and transform them to be comparable to other measures of food insecurity both during COVID-19 and prior to it.”
Diane Schanzenbach and Abigail Pitts
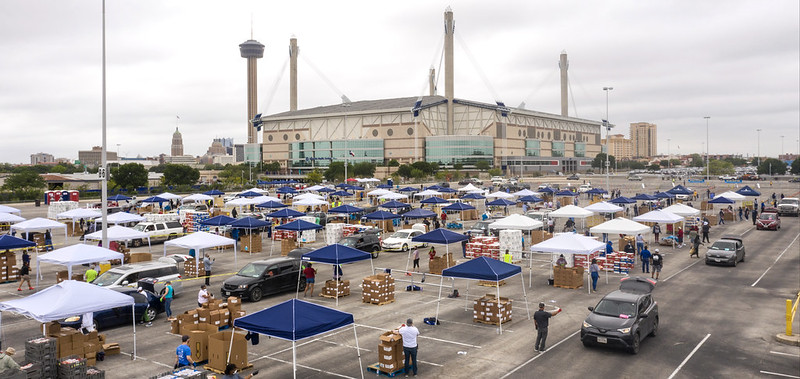
At a mass distribution site next to the Alamodome in Texas, recipients receive food from the USDA's Food and Nutrition Service Disaster Household Distributions and the San Antonio Food Bank.
The U.S. Census Bureau has begun releasing waves of their Census Household Pulse Survey (CHHPS) that collect information about household experiences during the COVID-19 pandemic, including several measures of food access. In this report, we analyze food insufficiency rates from the first two weeks of CHHPS summary tables and transform them to be comparable to other measures of food insecurity both during COVID-19 and prior to it. We take several approaches to the transformation, as described below, based on the relationship between food insecurity and food insufficiency in other datasets. We also explore using other information in the CHHPS to serve as a proxy for food insecurity, and conclude that the elevated rates measured in CHHPS reflect increased need and are not being driven in a meaningful way by lack of variety on store shelves.
We estimate rates of food insecurity from the CHHPS that, depending on the approach taken to map food insufficiency onto food insecurity, range in the first week of data collection from 22%–29% for respondents overall and 28%–35% among respondents with children. These estimates increased across waves. The estimates of food insecurity from the CHHPS are very similar to those found in the COVID Impact Survey (COVID Impact) and indicate that food insecurity rates have at least doubled from their previous levels. We also conclude that the attempt to assess retrospective food sufficiency status prior to the COVID-19 was unsuccessful.
Read the complete report for more information.
Table 2: Food Insufficiency & Regression Predicted Food Insecurity, 2 CHHPS Waves*
|
|
Census Household Pulse |
Census Household Pulse |
||||
|
Food Insufficient |
Predicted Food Insecurity: Level Model |
Predicted Food Insecurity: Log Model |
Food Insufficient |
Predicted Food Insecurity: Level Model |
Predicted Food Insecurity: Log Model |
|
|
(1) |
(2) |
(3) |
(4) |
(5) |
(6) |
|
|
Panel A: Respondents Overall |
||||||
|
Overall |
41.7% |
27.1% |
29.7% |
45.2% |
29.6% |
33.0% |
|
White |
36.1% |
23.0% |
24.4% |
39.4% |
25.4% |
27.5% |
|
Black |
52.2% |
34.8% |
40.2% |
59.4% |
40.0% |
47.8% |
|
Hispanic |
54.4% |
36.4% |
42.5% |
57.2% |
38.4% |
45.5% |
|
<=HS |
47.7% |
31.5% |
35.5% |
53.9% |
35.9% |
41.9% |
|
Some College |
45.5% |
29.8% |
33.3% |
48.0% |
31.6% |
35.8% |
|
BA+ |
30.4% |
18.8% |
19.3% |
31.3% |
19.5% |
20.1% |
|
Panel B: Respondents w/Children |
||||||
|
Overall |
47.6% |
32.5% |
35.0% |
50.9% |
34.9% |
38.0% |
|
White |
42.2% |
28.4% |
30.0% |
45.4% |
30.8% |
32.9% |
|
Black |
54.7% |
37.7% |
41.6% |
60.7% |
42.1% |
47.5% |
|
Hispanic |
56.7% |
39.1% |
43.5% |
58.2% |
40.3% |
45.1% |
|
<=HS |
56.0% |
38.6% |
42.9% |
61.4% |
42.7% |
48.2% |
|
Some College |
50.2% |
34.3% |
37.3% |
52.8% |
36.3% |
39.8% |
|
BA+ |
32.8% |
21.4% |
22.8% |
33.7% |
22.1% |
22.5% |
Source: Authors’ calculations from CPS-FSS 2015–18; Census Household Pulse Survey Food Sufficiency and Food Security Tables 2b and 3b.
*See the complete report for all tables and figures.
Photo credits: USDA Photo by Lance Cheung
Published: June 1, 2020. Updated: September 9, 2020.