Computer Model Uses Cell Phone Data to Predict How COVID-19 Spreads
Study identifies 'super-spreader' sites, shows how to better protect those most at risk for getting the virus
Get all our news
We show that mobility policy—which policymakers fully control—likely has large effects in generating disparities. This is good news because it means that the disparities can, in principle, be reduced.”
Beth Redbird
Assistant Professor of Sociology and IPR Fellow
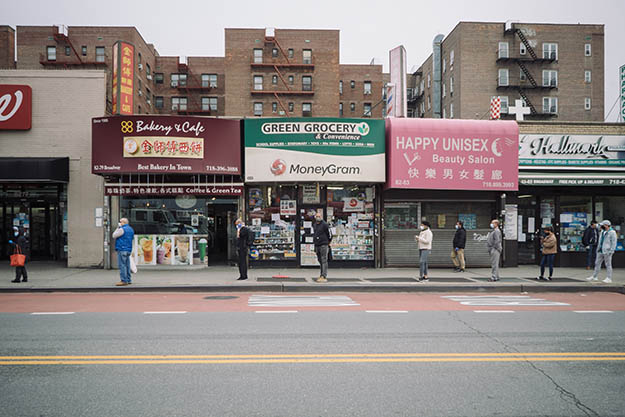
Grocery shoppers wait in line during the pandemic in Queens, New York.
Using anonymous cell phone data to map the hourly movements of 98 million people to places like restaurants, gyms, and churches, a team of Stanford and Northwestern researchers has created a computer model that accurately predicted the spread of COVID-19 in 10 of the largest U.S. cities this spring.
Perhaps just as importantly, their model also shows that beyond health policy, mobility policy has a critical role to play in reducing disparities in coronavirus infections and death rates.
“We show that mobility policy—which policymakers fully control—likely has large effects in generating disparities,” said IPR sociologist Beth Redbird, a co-author of the study published in Nature. “This is good news because it means that the disparities can, in principle, be reduced.”
Redbird, who uses GPS data to understand people’s mobility, collaborated with a multidisciplinary team on the project, including Stanford computer scientists and sociologist David Grusky, as well as Northwestern epidemiologist Jaline Gerardin.
Their study merges demographic data and epidemiological estimates with the cell phone location data. The researchers then analyzed three factors that drive infection risk—where people go in the course of a day, how long they linger, and how many other people are visiting the same place at the same time.
The model appears to confirm that most COVID-19 transmissions occur at “super-spreader” sites, such as full-service restaurants, fitness centers, and cafes, where people remain in close quarters for extended periods. It also reveals why the coronavirus disproportionately affects low-income Americans of color.
In layering demographic data from a database of 57,000 census block groups—neighborhoods of between 600 and 3,000 residents—into their model, the researchers show how minority and low-income people leave home more often because their jobs require it. They also shop at smaller, more crowded establishments than those with higher incomes, who can work from home, use online grocery shopping and delivery, and frequent more spacious businesses.
The study revealed that it is roughly twice as risky for Black, Latino, and other underrepresented groups to buy groceries as compared with Whites.
“This study demonstrates that the way low-income neighborhoods are constructed, with smaller establishments that serve more customers, is one of the drivers of racial and economic inequality in infections,” Redbird said. “It also shows that, by reducing density in these locations, we might reduce this disparity.”
The team has made its tools and data publicly available on the COVID-19 Mobility Network Modeling site so other researchers can replicate and build on the findings.
Source: Chang, S., E. Pierson, P.W. Koh, J. Gerardin, B. Redbird, D. Grusky, and J. Leskovec. 2020. Mobility network models of COVID-19 explain inequities and inform reopening. Nature.
Beth Redbird is assistant professor of sociology and an IPR fellow.
This research was supported by the National Science Foundation, the Stanford Data Science Initiative, the Wu Tsai Neurosciences Institute and the Chan Zuckerberg Biohub.
Photo credit: M. Giachetti, istockphoto.com
Published: November 11, 2020.