Most Americans Willing to Vaccinate for COVID-19, While Testing Speeds Lag
Survey shows average wait times miss the window for optimal contact tracing in 44 states
Get all our news
This is an unfortunate reflection of the system being overloaded since after a certain number of days, receiving the test result becomes less useful.”
James Druckman
Payson S. Wild Professor of Political Science and IPR Associate Director
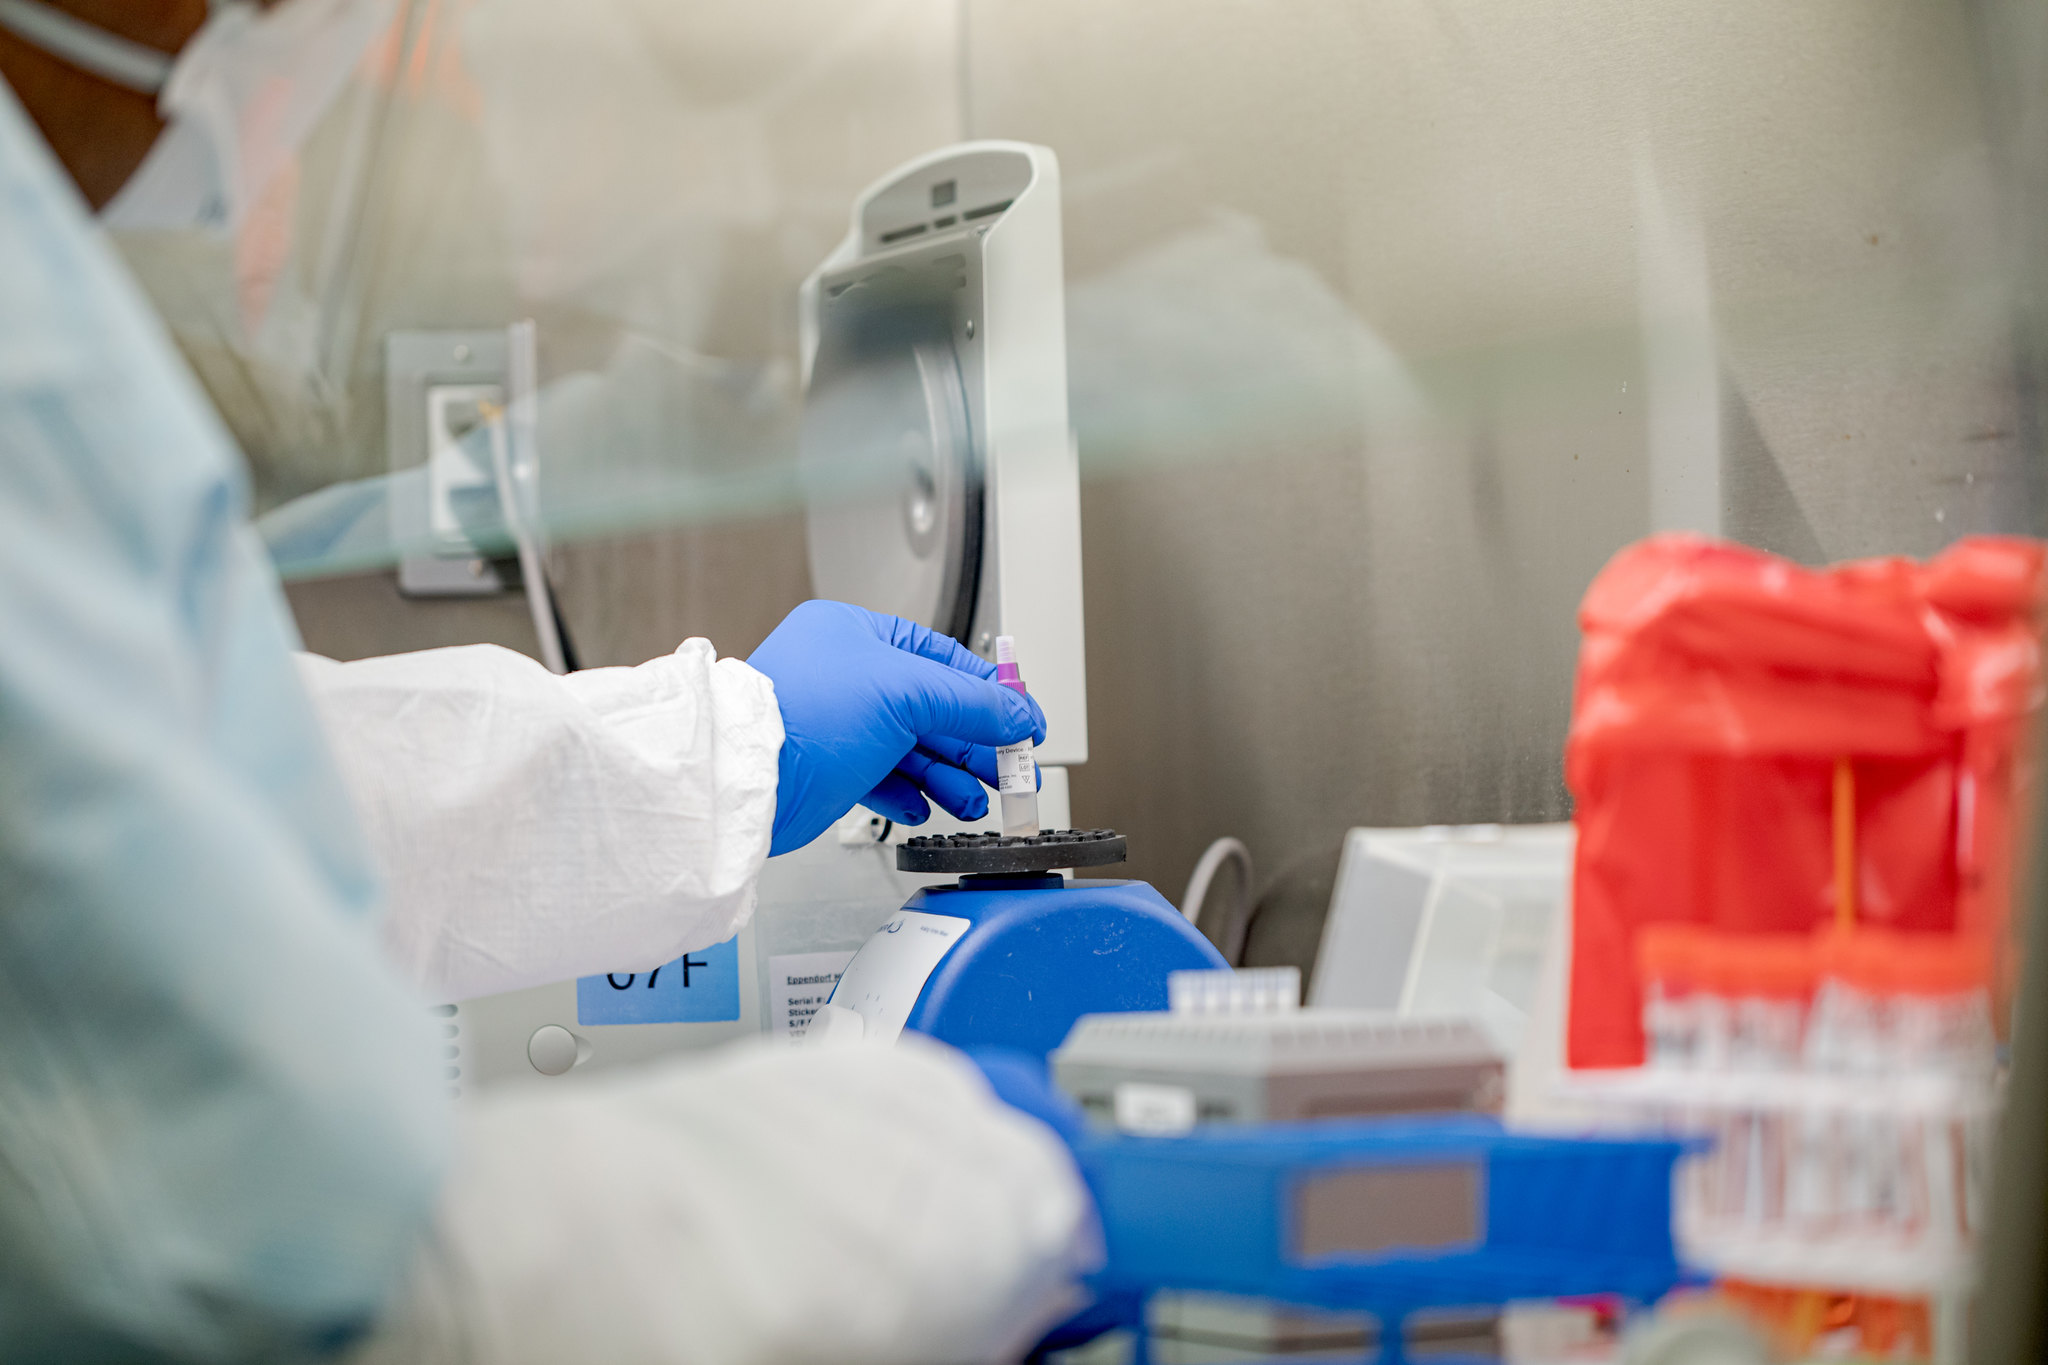
Researcher examines a COVID-19 test to find out results at the Pennsylvania Department of Health Bureau of Laboratories.
According to the latest results from an ongoing national survey of attitudes about COVID-19, two-thirds (66%) of Americans say they are either “somewhat” or “extremely” likely to vaccinate themselves and their children against the novel coronavirus when such a vaccine becomes available.
At the same time, Americans are waiting four days on average to find out the results of COVID-19 nasal swab tests, according to survey results collected between July 10 and 26. This is double the ideal amount of time of 1–2 days for effective contact tracing of COVID-19 cases.
“This is an unfortunate reflection of the system being overloaded, since after a certain number of days, receiving the test result becomes less useful,” said IPR political scientist James Druckman, a researcher in the consortium of four universities conducting the surveys that comprises Northwestern, Harvard, Northeastern, and Rutgers. More than 19,000 Americans participated in each wave of the nationally representative survey that is supported by the National Science Foundation.
Despite 37% of test results being received within two days, 31% took longer than four days, and 10% were not available until 10 days or later. The results show that the averages are similar across states, highlighting the national scope of the lengthy wait times. Only six states—Hawaii, Iowa, Kentucky, New Jersey, Ohio, and Washington—had an average wait time of only two days. Eleven states and the District of Columbia had average wait times clocking in at more than three days, with the remaining 33 states waiting three days on average for test results.
Similarly, enthusiasm for a potential COVID-19 vaccine varied greatly across the states. Rates of those describing themselves as “somewhat” or “extremely” likely to vaccinate fell below 60% in 11 states mostly in the South and Mountain West regions, while they exceeded 70% in 11 states across varied regions of the country. Likewise, partisanship plays a role in enthusiasm for a vaccine: 62% of Republicans say they would be likely to seek vaccination, compared with 75% of Democrats.
Druckman and his colleagues also discovered racial disparities in both vaccination likelihood and when people received test results. Testing wait times for White respondents averaged 3.9 days, 4.6 days for Hispanic respondents, and 5 days for African American respondents. The researchers note that “longer wait times for African Americans and Hispanic Americans mean that containment strategies will be less effective in those populations.”
When it comes to vaccinations, the disparity is due to attitudes, not outcomes. While 67% of Whites, 71% of Hispanics, and 77% of Asian American respondents say they were likely to vaccinate, just 52% of African American respondents said the same. Respondents with lower levels of education, and lower incomes, also said they were less likely to seek a vaccine.
“One of the most notable findings is the racial disparity with African Americans reporting substantially lower likelihood of being vaccinated,” Druckman said. “Given the disproportional effect the virus has had on African Americans, this is an important gap to consider moving forward.”
Other key findings of the latest two waves of the survey include:
- For those likely to vaccinate, 62% identify the need to protect themselves and their families as a motivation, 45% cite protecting people in their community, and 59% identify recommendations of medical professionals.
- Among those with the least trust in President Donald Trump, 72% were likely to seek vaccination, while among those with the greatest trust, 61% were likely to seek vaccination.
- Both young adults (18-24) and older adults (65+) more often say they would be likely to be vaccinated, at 71% and 73% respectively, than those ages 25-44 and 45-64 (63% and 64%, respectively).
- Most people, or 63%, are not getting results with the 1–2 days that would be optimal to do contact tracing.
- A substantial minority of individuals, or 21%, are receiving test results too late to be an assistance in preventing the spread of COVID-19.
- The long wait times are national in scope, with most states reporting an average wait time of three days or more.
- The states with the longest wait times, more than 3 days on average, were Arizona, Arkansas, California, Delaware, Florida, Montana, Nevada, Oklahoma, South Carolina, Tennessee, and Texas, in addition to the District of Columbia.
James Druckman is the Payson S. Wild Professor of Political Science and IPR Associate Director. Read the current reports here testing wait times and here on vaccinations, as well as the previous reports.
The COVID-19 Consortium for Understanding the Public’s Policy Preferences Across States is a joint project of Northeastern University, Harvard University, Rutgers University, and Northwestern University.
These reports are based on work supported by the National Science Foundation (NSF) under grants SES-2029292 and SES-2029297. Any opinions, findings, and conclusions or recommendations expressed here are those of the authors and do not necessarily reflect the NSF’s views.
Photo credit: Pennsylvania Department of Health Bureau of Laboratories
Published: August 6, 2020.