Food Insecurity Remains at Persistently High Levels in May
Second week of data continue to show 1 in 3 respondents reporting food insecurity; 1 in 10 in New York and Texas reported help from a food pantry in the previous week
Get all our news
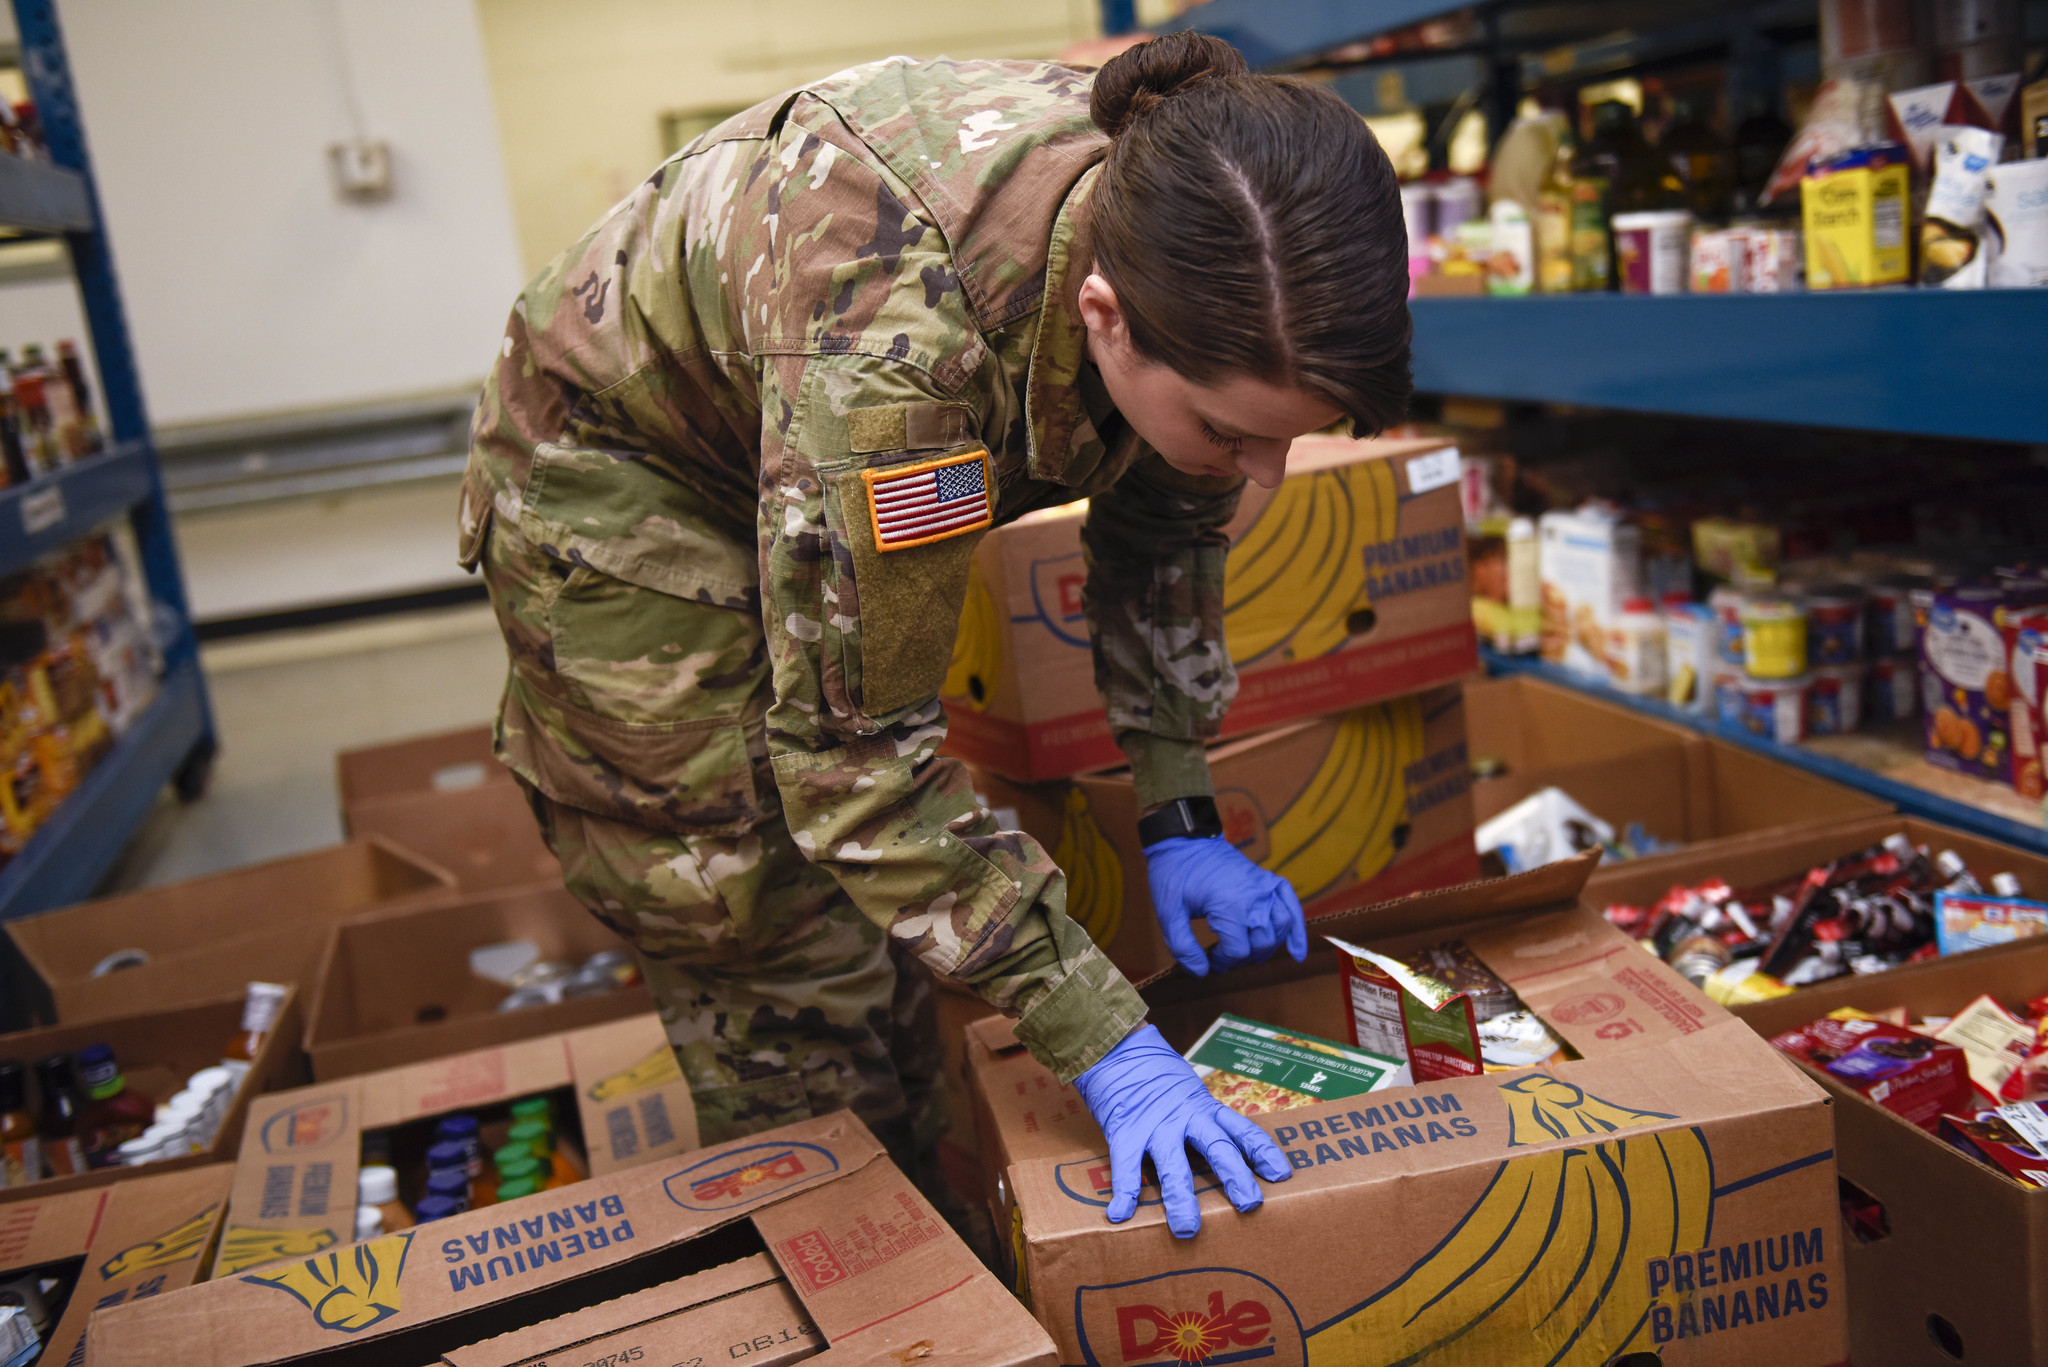
A member of the National guard helps at a food bank in Ohio.
In their May 18 report, IPR Director and economist Diane Whitmore Schanzenbach and research analyst Abigail Pitts continue to monitor changes in economic and health outcomes during this fast-moving crisis. They updated estimates of food insecurity during the COVID-19 crisis, analyzing data from May 4–10 from the COVID Impact Survey to describe levels of food insecurity by race, income, and presence of children in May 2020.
Their latest results show:
- Food insecurity remains elevated and statistically unchanged, with food insecurity rates twice as high overall—and nearly three times as high among respondents with children—as they were predicted to be in March.
- Between the April and May surveys, food insecurity declined among white respondents and increased among black respondents. In May, a majority of black respondents with children reported they were food insecure.
- Seven percent of respondents reported receiving benefits from food pantries over the prior 7 days, a rate that was statistically unchanged across months.
- A substantial share of respondents report applying in the past 7 days for benefits from Unemployment Insurance (UI) or the Supplemental Nutrition Assistance Program (SNAP), with declines in reported applications across waves.
- Rates of food insecurity and food pantry use continue to vary widely across states and metropolitan areas represented in the survey.
Below are some key findings from the report. The full report can be read online.
FINDINGS
Food insecurity was statistically unchanged between the April and May surveys and remains greatly elevated above the rate we predicted for March, especially for respondents with children. As shown in Figure 1, overall food insecurity more than doubled to 22% in the pooled April and May COVID Impact Surveys compared to the predicted level for March. Food insecurity remains particularly elevated among respondents with children, with 1 in 3 respondents with children reporting food insecurity. Among those with children, the April-May measure of food insecurity has nearly tripled with a rate that is 2.85 times what was predicted for March.
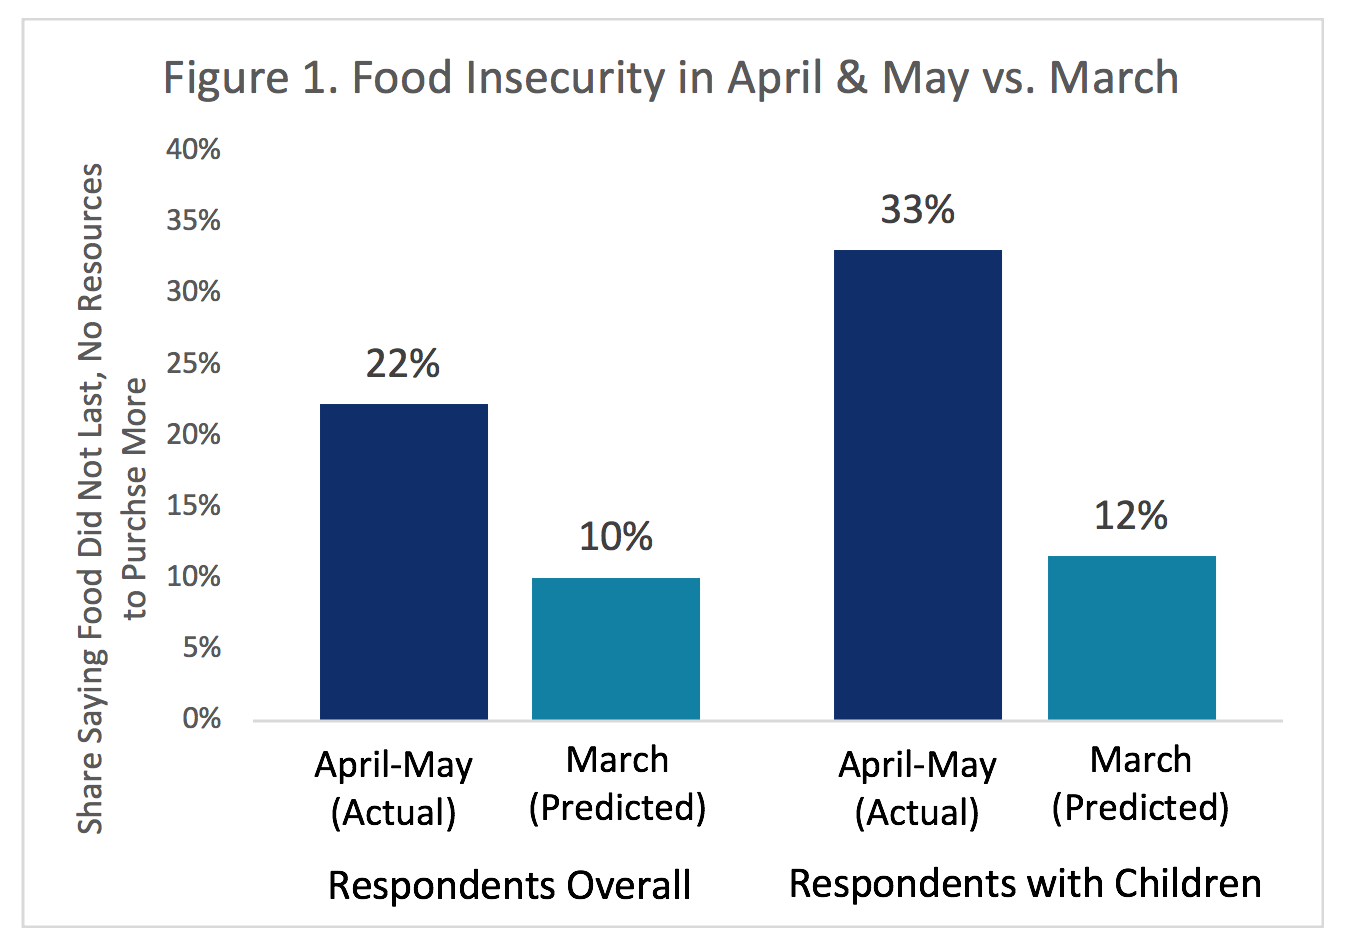
Notes: April and May reports of food insecurity calculated from the COVID Impact Survey and weighted by national panel weights. March rates were predicted based on unemployment rates and monthly data from the National Health Interview Survey, see our prior report for details.
Table 1 below reports food insecurity across the April and May waves of the COVID Impact Survey, overall and separately by presence of children and by race and ethnicity of the respondent. Column (1) displays the average rate of food insecurity across both waves of data collection. Columns (2) and (3) present average rates in the May and April surveys, respectively. Column (4) shows the differences between the May and April surveys, with stars indicating statistically significant differences. For respondents overall (shown in Panel A), food insecurity averages 22% and is unchanged between waves. There were heterogeneous differences across race and ethnicity groups. Among white respondents, food insecurity declined by a statistically significant 4 percentage points between the April and May waves, while it increased by over 8 points for black respondents and remained unchanged among Hispanics.
Table 1. Food Insecurity in the United States April 20–26 and
|
||||
| Panel A: All Respondents | ||||
| Average April & May | May 4–10 | April 20–26 | Difference | |
| (1) | (2) | (3) | (4) | |
| Overall | 22.3% | 21.7% | 22.8% | -1.1% |
| White | 16.3% | 14.4% | 18.2% | -3.9%*** |
| Black | 33.2% | 37.5% | 29.0% | 8.4%** |
| Hispanic | 34.1% | 33.9% | 34.2% | -0.4% |
| Panel B: Respondents with Children | ||||
| Average April & May | May 4–10 | April 20–26 | Difference | |
| (1) | (2) | (3) | (4) | |
| Overall | 33.2% | 31.6% | 34.5% | -2.9% |
| White | 26.2% | 18.3% | 32.9% | -14.6%*** |
| Black | 44.1% | 51.4% | 37.7% | 13.7%* |
| Hispanic | 42.8% | 44.3% | 41.6% | 2.6% |
| Panel C: Respondents without Children | ||||
| Average April & May | May 4–10 | April 20–26 | Difference | |
| (1) | (2) | (3) | (4) | |
| Overall | 18.6% | 18.8% | 18.3% | 0.5% |
| White | 13.6% | 13.4% | 13.9% | -0.5% |
| Black | 28.7% | 32.2% | 25.2% | 7.0% |
| Hispanic | 29.5% | 29.4% | 29.6% | -0.1% |
Notes: April and May reports of food insecurity calculated from the COVID Impact Survey. Differences denoted by stars ***, **, *represent those statistically significant at the p<0.001, p<0.05 and p<0.10 levels, respectively.
Table 2 presents food insecurity rates across urban, suburban, and rural areas, pooled across the two survey waves. Overall, there are no statistical differences across location type. Food insecurity averages 23% in urban areas and rural areas, and 21% in the suburbs. Food insecurity is higher among respondents with children—with over 1 in 3 reporting food insecurity in rural and urban locations, and 28% in suburban ones. Between the April and May surveys, food insecurity statistically declined among suburban residents overall and among suburban residents with children.
Table 2. Food Insecurity by Population Density |
|||
| Rural | Suburban | Urban | |
| (1) | (2) | (3) | |
| All Respondents | 23% | 21% | 23% |
| Respondents with Children | 33% | 28% | 34% |
| Respondents without Children | 20% | 18% | 18% |
Note: Data pooled across April and May survey waves and weighted using national weights.
Food Insecurity and Food Pantry Use, by State and Metropolitan Area
The COVID Impact Survey also collected representative information for a select set of states and metropolitan areas. Table 7 here presents estimates of rates of food insecurity and food pantry use in 10 states and 8 metropolitan areas, with 95% confidence intervals in the even columns. Information was combined from the April and May surveys, as there were very few statistically significant changes across months. The exceptions include that between April and May food insecurity in Florida declined, and food pantry use statistically increased in California and Florida and declined in Colorado. Notably more than 1 in 10 respondents in the states of New York and Texas reported receiving help from a food pantry in the previous seven days.
Find the complete table here.
Summary and Conclusions
Results from the second wave of the COVID Impact Survey continue to demonstrate a dramatically elevated rate of food insecurity, especially for respondents with children. Food insecurity rates are high across all subgroups of the population—all racial and ethnic groups, and across urban, suburban, and rural areas.
The extent of economic distress experienced by families continues to require an urgent and sustained response from the federal government. We will continue to analyze food insecurity and related outcomes in the next wave of the COVID Impact Survey, expected in June, to provide the evidence needed to track the evolution of both COVID-19’s impact on the population and the response of the public and private sector.


Diane Whitmore Schanzenbach is the Margaret Walker Alexander Professor and IPR Director. Abigail Pitts is a research analyst. Read the complete report.
Photo credits: U.S. Air National Guard photo by Senior Airman Kregg York (top), J. Ziv (Schanzenbach)
Published: May 18, 2020.