App Explores Seven Key Economic Topics
Data highlight the severity of the ongoing pandemic crisis for many Americans
Get all our news
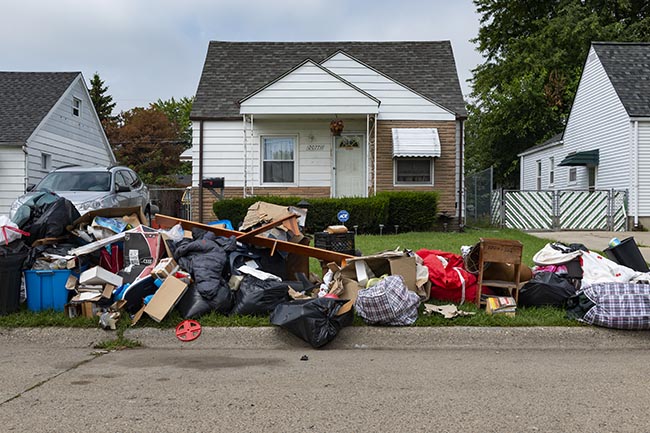
An evicted family's belongings line the street in Detroit. The app provides information on seven economic indicators, including on missed mortgage or rent payments.
During the COVID-19 crisis, rates of food insecurity, job losses, and missing mortgage or rent payments have been high. People have been reporting difficulty in paying for their usual household expenses, and their feelings of anxiety and worry have increased.
Our new app, which draws on the U.S. Census Bureau’s Household Pulse Survey data that have been collected since April, provides snapshots of seven key economic indicators that highlight the severity of the ongoing crisis for many Americans.
On average nearly 54% of respondents and more than 60% of those with children reported losing employment income, according to data released by the U.S. Census Bureau’s Household Pulse Survey from April 23–November 23. We estimate that 22.1% of all respondents and 28.9% of respondents with children experienced food insecurity.
Food Insecurity and Housing Payment Rates Vary Widely
As described in our earlier work, the Household Pulse Survey asks respondents to describe the availability of food in their homes. We find that estimated rates of food insecurity from October 28—November 23 vary widely across states, ranging from just over 1 in 10 in Vermont to 1 in 3 in New Mexico.
Food insecurity also continues to differ across racial and ethnic groups. The data show rates of 31.3% among Black respondents, 30.2% among Hispanic or Latino respondents, 18.3% among White respondents, and 18.8% among Asian respondents. Among respondents with children, food insecurity is uniformly higher.
App Allows Users to Visually Explore Results by State on Seven Key Topics
Using the Household Pulse Survey, we have created an app to allow users to explore visualizations of the following seven key indicators for each state:
- food insecurity,
- employment,
- housing,
- expectations,
- mental health,
- finances, and
- children’s education.
The app allows users to sort for specific indicators by different racial and ethnic groups, as well as providing estimates over time for individual states.
The figure below provides an example of how users can visualize the data. Here, it shows rates of respondents who indicate they are behind on their rent or mortgage payments in New York (in blue) and the United States (in black). The thin gray lines on the graph represent the data for the other 49 states and Washington, D.C. The app displays the estimated rate in each survey period, but users should note that there is substantial sampling variation and not all across-week changes are statistically meaningful.
Rates of Rent/Mortgage Delay or Non-Payment for All Respondents in New York and the U.S. from April 23–November 23
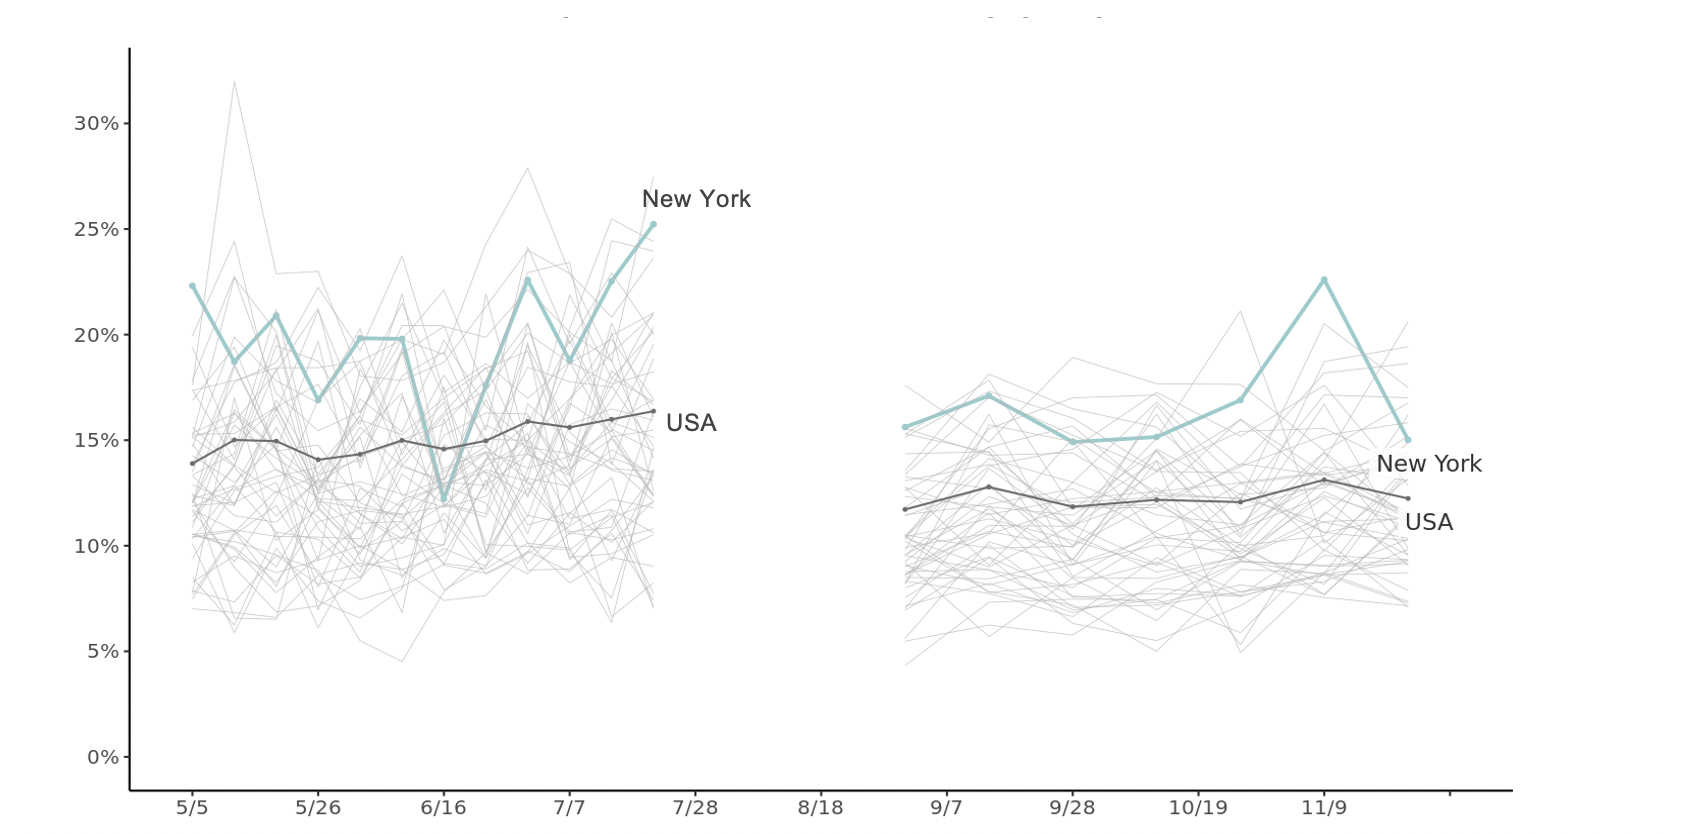
The data also reveal increases in those who are behind on their rent or mortgage payments. Nearly 13% of Americans across the nation reported missing a rent or mortgage payment in surveys from October 28–November 23, and these rates vary among states. More than 15% of respondents report being behind on housing payments in eight states—Alabama, Georgia, Louisiana, Mississippi, New Jersey, New Mexico, New York, and South Carolina—as well as Washington, D.C.
Read the full report for more information about the app and notes on the data.
Diane Whitmore Schanzenbach is the Margaret Walker Alexander Professor and IPR Director. Natalie Tomeh is a Northwestern senior in economics and mathematical methods in the social sciences and an undergraduate research assistant.
Photo credit: Tiago_Fernandez, iStock photo
Published: December 21, 2020.